The busiest day on the roads this Christmas…
With millions of us travelling to see friends and family over the festive season, the UK’s road networks can be filled to capacity on one or two key dates over the holidays. The dates change each year, depending on when Christmas Day falls, so transport planners and road users alike need to plan well ahead.
Friday December 21st
According to a survey by the AA of around 20,000, most people are planning to travel on Friday December 21st. For many people, this will be the last day in the office; the kids have broken up from school, and everyone is hitting the roads to get to their families for a full weekend ahead of Christmas. So, what does that mean for the road network?
Congestion
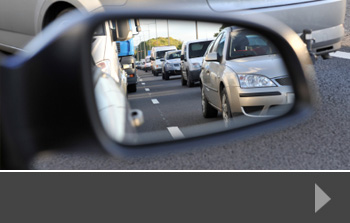
Nearly 60% of those surveyed said they would be on the roads on the 21st, which means the network has to cope with far more traffic than usual – even for a Friday. Drivers should expect their journeys to take longer than usual and be prepared to sit in traffic jams. There are several areas on high-traffic motorways where roadworks are still in progress, with 50 mph restrictions and these are likely to be high points of congestion.
What to do
- Do you really have to travel on Friday? If you do, can you leave earlier to avoid the later traffic caused by people finishing work early or travelling straight from the school pick-up? Would it matter if you left early on Saturday morning instead of on Friday afternoon? For longer journeys, setting off early in the morning can take a lot of the hassle out of the journey, and still get you to your destination at a reasonable time.
- Check current traffic conditions before you leave. Google Maps has a function where you can say what time you’d like to arrive at your destination, and it tells you when you might leave in order to get there on time.
- Make sure that, as well as the Christmas presents, the food, the wrapping paper, the booze and the overnight bags, you pack anything you might need in the event of a breakdown. Join a breakdown service or, if you’re already a member, make sure you have your membership card with you.
- If there is something wrong with you vehicle on the motorway, try to take the next exit off the motorway, or go into a services area if that’s closer. If you can’t do that, pull over onto the hard shoulder, put your hazard lights on and get out of the vehicle – preferably by the doors closest to the embankment. Call your breakdown service – you can do this from your mobile phone or from one of the emergency phones on the side of the motorway.
About Road Data Services
Road Data Services is a traffic and pedestrian data specialist. We conduct a range of bespoke traffic surveys, journey time data collection, parking and pedestrian surveys, providing data to a range of decision makers including developers and local planners. Our data helps to inform decisions that involve changes to the existing road network, or the design, construction and use of new roads. For more information about how we can help with your next project, contact us today.
If, like most people, you’ve sat in your car in a traffic jam wondering why the gas repairs are being done at the same time as the new development building, you’ll be encouraged by the knowledge that planners and transportation leaders are working hard to determine how to streamline new projects and improvements to existing infrastructure to help keep things moving.
This type of work is data driven – that data might come from traffic surveys and on-site data collection or it might come from historic reports, or from working alongside other providers such as the rail network or local utility companies.
Inrix, a leading traffic information supplier, says that its data shows that traffic congestion in the UK costed more than £37 billion in 2017 with, on average, 31 hours per year spent in congestion per driver. That’s a huge dent in the economy – both nationally and regionally.
Understanding traffic data
Underpinning improvements in this area is all about taking the time to understand what happens on our roads on a day-to-day basis, and how that activity is affected by roadworks, improvements and development work. That means looking at the knock-on effects as well as the immediate impact. When considerable works are in place, the journey time from A to B using that route will be increased. To know what the increase might be, you need a bench measure for that journey, hence the journey survey.
Planners and project managers also need to take into account the potential for routes around the area to become more congested as drivers try to avoid the works. That means either creating a good diversion route, or knowing what the key alternative routes might be, and ensuring there are no works or blockages on those routes whilst the major work is taking place. By communicating and co-ordinating, agencies can help each other to minimise the impact of works on road users.
Road traffic surveys from RDS
At RDS, we offer a wide range of detailed surveys to help transport, planning and project professionals understand the potential impact of work in a given area. Whether it’s for long-term roadworks or improvements, or for planning a new road system to serve a residential or commercial development, it’s important to understand the current state of play in terms of journey time, congestion, parking and pedestrian usage.
We offer comprehensive surveys with accurate data supplied in the format that’s best for you. To find out more about how we can help, contact us today.
Earlier this month, the Department of Transport (DoT) announced that it will invest £10 million to create a new app showing real-time traffic congestion across the UK. The new technology, which will be called Street Manager, will be made available to companies and app developers free of charge.
The DoT wants to help drivers combat traffic congestion and reduce the hours often wasted sitting in traffic jams, which can have a knock-on effect on the wider economy. The government is also concerned about roadworks – especially those for utility purposes – that cause congestion at peak travelling times, and have already given local authorities the power to fine utility companies up to £2,500 per day for interrupting traffic flow. These fines, it hopes, will also encourage local authorities to ask utility companies to liaise with each other so that work can be carried out at the same time, leading to fewer disruptions.
Collaborating with other traffic apps
The Street Manager system will replace the government’s current technology, which often has out-of-date information about roadworks and speed restrictions. The government is hopeful that popular route-mapping systems like Google Maps and Waze will use Street Manager to update their own apps with details of roadworks, helping users to plan journey more easily and spend less time stuck in traffic.
It’s estimated that UK drivers waste more than 30 hours in traffic jams every year. That’s frustrating for the average driver, but for those businesses that rely on the road network in order to make deliveries, transport goods, or provide services, it can mean a hit to the bottom line.
Neither government nor local councils want to see an increase in traffic – aside from the fact that it discourages people to travel to and around local places, standing traffic also contributes to air pollution and damage to the environment.
Local traffic surveys from RDS
Data on current traffic conditions can be collected in a variety of ways. A change in the road layout, a new development or long-term roadworks or road closures can all contribute to local traffic congestion problems. To plan ahead for these situations, commission a traffic survey – the data we provide at RDS is accurate, timely and useful in the decision-making process. We can tailor our surveys to your precise requirements and supply the data in whatever format is best for you.
To find out more about how we can help, contact us today.
Earlier this month, the Transport Select Committee launched an inquiry into the funding and governance of local roads in England. This is an acknowledgement of the considerable amount of traffic carried by the local network and the relative lack of funding and upgrading when compared to the main motorway network.
In fact, local roads make up 98% of England’s road network – which totals about 245,000 miles of road – and they carry the majority of traffic. Whilst the government has been keen to sort out the motorway network, with a variety of extension and upgrade programmes, local roads tend to be the responsibility of local authorities and so maintenance and upgrade varies across the network.
What is the Committee is looking for?
The Transport Select Committee wants to get a clear picture of the current state of local roads across England and the approach to funding and maintenance. In particular, they want to see written evidence about:
- The condition of local roads in England and how they have fared over time, particularly compared with other parts of England’s road network;
- The direct and wider economic and social costs of not maintaining local roads;
- The quality of monitoring and reporting of local road conditions;
- Whether the current approach to maintenance of local roads is appropriate and whether it needs to be improved;
- The suitability of governance structures for maintaining local roads and whether any changes are required;
- The funding requirements of local roads and the suitability of current funding streams for the immediate and longer-term future;
- Whether there is a role for alternative funding models for local roads maintenance and investment; and
- The regional distribution of local roads funding across England.Professional traffic surveys give an accurate picture of local road use, including areas that are regularly congested, and roads that are often used as shortcuts or ‘rat-runs’. Our local traffic surveys are often used to inform decisions about re-routing, upgrading or introducing traffic-calming measures and can go hand-in-hand with plans for new residential, commercial or retail developments. They provide excellent, up-to-date data about the ways particular roads and routes are used.To find out more about our traffic, journey time, Automatic count and other dedicated surveys, contact us today.
- The Transport Select Committee’s inquiry is taking evidence until October 2nd, and anyone who wants to contribute can put their evidence in writing and submit it via the Committee’s website.
- How can traffic survey data help?
It’s a hot topic both for transport professionals and for the family in the street – how do we improve air quality and how do we protect ourselves from pollution? In a month where scientists from the University of Leeds have reported that one in four child asthma cases in Bradford are linked to air pollution, it’s a problem that needs to be addressed in a number of ways – including with dedicated traffic surveys.
Quantity and quality
It’s both the quantity of traffic on the roads as well as the quality of that traffic that contributes to air pollution. In environments where there are often traffic jams with car engines idling, air quality becomes extremely poor, and those walking next to the road can breathe in harmful fumes. Perhaps surprisingly, just being more than a metre away from the road can drastically improve the quality of the air you breathe. And, just as surprisingly, if you’re in the car in a traffic jam, you can still be inhaling harmful air – so wind up the windows and turn the fans off if practical.
Quality matters too – there is a lot of information about the potential harm from diesel vehicles. So those people – and transport companies – that are changing to hybrid or completely electrical vehicles are already having a positive impact on the air quality around them.
Making roads more effective
Part of the issue in the UK is the road system itself. In many places, it’s often not fit for purpose – too many cars and not enough lanes, junctions or by-pass options. This in itself causes congestion. In addition to encouraging more people to use public transport, or walk when they might usually drive, local authorities and transport planners need to look at the road systems themselves. Solutions like smart traffic lights may be able to improve traffic flow, whilst in busy areas, speed and queues can be regulated by traffic calming measures.
The key to getting to solution right is to know how big the problem is. That’s where a high-quality traffic or journey time survey can help. Understanding the road use, the heavy-usage times and the other routes that drivers use to avoid problems will all help with better road planning, which in turn may help to improve air quality in the future.
Traffic surveys from RDS
To find out more about the way our professional traffic surveys can help your next project, talk to us today.
A huge amount of money is lost by UK businesses every year because of congestion on the roads, according to research by a specialist vehicle hire company.
Northgate Vehicle Hire found that most congestion occurred because of temporary speed limits or long-standing roadworks; either by utility companies or highways agencies. It’s thought that drivers spend around 32 hours per year on average in traffic jams, and those who drive for a living, like road haulage workers or delivery drivers, spend considerably more time at a standstill.
At the same time, our roads are expected to bear the burden of more traffic, with government figures suggesting that traffic levels could increase by more than 50% in the next 20 years. Even with the advent of electric vehicles, which will certainly reduce pollution levels, the weight of traffic on UK roads is only going to grow – and the road infrastructure must be able to handle it.
How can traffic surveys help?
Understanding how traffic uses the road system gives decision makers clear and reliable information on which to make plans for the future. Both traffic surveys, automatic traffic counts and journey time surveys provide valuable data that lets highways specialists see which times and routes are the busiest. This in turn will help to inform decisions on roads that need widening, on traffic calming or traffic management measures. It can also help when agencies are planning roadworks or repairs – all too often work is being carried out on major routes at the same time, meaning that there is no easy route for traffic in the area.
Congestion has a quantifiable knock-on effect to local economies. In Belfast, for example, it’s estimated that businesses lost 24 working days per vehicle per year to congestion in 2015, at a financial cost of around £12.6 billion. This, in just one of the UK’s main cities, shows just how much productivity is lost to traffic congestion and how improving the road network and planning ahead for activities that regularly cause traffic problems could help to improve local economies.
Traffic surveys from RDS
At Road Data Services we specialise in a range of dedicated road, traffic, journey and pedestrian surveys which collect accurate, reliable data. We use a range of methods and supply data in whichever format is best for you, giving you the information you need to make informed decisions about road changes, traffic management, access to new developments and much more.
A report published by the Department for Transport shows a fall in journeys made by bike and suggests that cyclists are worried about their safety because of the volume of traffic on the roads.
The report was based on the results of two surveys carried out across England. It showed that, whilst people were making an average of 18 journeys by bike per year in 2014, that number had dropped to 15 journeys in 2016 – although the distance those cyclists were travelling had increased.
It’s a worrying trend for promoters of cycling as an alternative to cars, and also for local and national government, which wants to encourage more journeys by bike. In 2017, the government published a cycling and walking investment strategy, but pressure groups say that the strategy is underfunded, with all but the largest cities failing to spend enough on safe lanes or spaces for cyclists and pedestrians.
Why are people worried about cycling?
Cycling on the roads can be a dangerous business, particularly on roads where no cycle lanes exist, or where the roads are not well-maintained. Cyclists often find their path is littered with potholes, drain covers and poorly-kept kerbs, making it difficult to ride safely. Greater driver education is also necessary, say cycling groups, so that drivers do take the time to slow down, overtake safely and give cyclists space.
The figures showed that women are more likely than men to be put off by the state of the roads or the possible dangers of busy traffic, but that most groups would get out on the bike more if they felt safer. This is a clear guide to legislators, and the government is expected to announce a review of cycling safety later this year, which may include whether to make it a legal requirement to wear a cycle helmet.
The places where cycling is most successful are those places where cycle lanes are wide enough and well-maintained; where there is plenty of signage, and where cyclists are taken off the roads at particularly busy or dangerous places and put on a footpath cycleway instead. These are expensive retro-fit things to put in place but, with the proper data and the right planning, it should be possible to cater safely for cyclists and pedestrians where new routes are being planned.
Talk to Road Data Services
If you are planning a new development or looking for innovative ways to improve a local road system, talk to us about our transport, traffic and pedestrian surveys. We provide accurate, relevant data that helps you to make informed decisions that are in the best interests of all road users. To find out more, contact us today.
In a week where London has announced the T-Charge and Swansea has introduced a diversionary system for traffic when air pollution is particularly bad, the role of traffic surveys and monitoring is becoming ever-more important to the health and wellbeing of the population.
Traffic’s contribution to air quality
There’s no doubt that the increase in the number of vehicles on the road contributes to poorer air quality. Diesel vehicles in particular have been pinpointed as damaging to the environment, and the T-Charge introduced by the Mayor of London this week means that drivers bringing older, more polluting cars into the capital will have to pay an additional £10 fee on top of the congestion charge. London’s air quality is often extremely poor, with around 9,000 premature deaths per year linked to air pollution, according to the Mayor.
Understanding where and how the traffic pollutes most is part of designing and implementing a workable solution, so professional traffic surveys look at congestion points, the number of vehicles on the road over a range of times during the day and night, and how those journeys might be diverted or completed in other ways.
Diversions in Swansea
Councillors have been so worried about air pollution in certain areas of Swansea that they have invested in a system that monitors the air quality and diverts drivers away from affected areas when necessary.
The scheme, which is called Nowcaster, uses dedicated road signs on the approach to the affected areas. The boards advise drivers to use an alternative route, but they do not have to follow the advice. Councillors hope that the boards will help to divert some traffic, reducing congestion and improving air quality on particularly poor days.
An issue to take seriously
The poor quality of air is a serious problem in cities across the UK. Roads are becoming even more congested and, although newer cars have an engine shut-off system that avoids engines turning over at traffic lights or in traffic jams, the majority of older cars do not, so pollution is pumped out of exhausts all the time. As local councils address this problem, they need accurate data to work from so that they can plan for a healthier future.
Traffic surveys from RDS
At RDS we work with councils, planners, developers and other interested parties to get a clear idea of what is happening on our roads and provide the data that helps decision makers to plan for routes, systems and projects that aim to improve air quality. To find out more about how any of our surveys can help you to gather reliable information for your air pollution issues, just contact us today.
There are many reasons for initiating peak hour traffic surveys, and one of those is to discover just how busy our roads get during this time. When travel is slow and journey times are longer, people become more frustrated, pollution increases and residents and workers may even start to look for somewhere else to live and do business.
Case study: Bradford
A recent report in the Telegraph and Argus, Bradford’s local paper, says that some roads see an average speed of less than 15mph during rush-hour traffic, with the busiest road averaging just 10mph. These roads are the key routes in and out of the city and morning traffic includes commuters and school traffic. The added pressure on the roads increases pollution, adds to the damage on the road itself and makes for a miserable start to the day.
To try and combat this problem, Bradford is teaming up with other local authorities across West Yorkshire to draw up a regional plan to tackle congestion. Currently, a real-time traffic monitoring system is being tested, which can control traffic signals based on the amount of traffic on the roads, and link up with sat nav systems to direct traffic away from areas that are already bottlenecked. Other ways to reduce the traffic include adding more park and ride options at the outskirts of the city, and planning with rail partners, who are adding extra carriages to certain trains in the future.
The councillor managing transport issues for Bradford said that the city needed to concentrate on easing choke points around the area, and on encouraging people to move from the one-person-one-car habit so that they can make smarter travel choices.
Keeping an eye on the traffic
It’s important for all local authorities to keep a constant watch on traffic movement and build-up in their areas. Whether traffic changes seasonally, with school holidays or students arriving at university, or whether it’s affected by large housing developments or new retail facilities, the consequences to the life and health of an area with constantly clogged-up roads can be serious.
Regularly auditing traffic flow, journey times, pedestrian travel and parking arrangements help local authorities to plan ahead, and to have the data they need to forecast potential traffic issues relating to local development plans.
Traffic surveys from RDS
At Road Data Services, we conduct a wide range of traffic and pedestrian surveys, supplying high-quality data that enables our clients to make informed decisions. We use the latest technology and design the survey to meet your needs. To find out more, or to arrange a survey for your next project, please contact us today.
As election day draws closer, the Parliamentary Advisory Council for Transport Safety (PACTS) has appealed to all political parties to make improved road safety a priority during the next Parliament.
PACTS wrote to all major parties after the election had been announced, saying that more needs to be done to reduce the number of deaths on the road. This is particularly concerning for the Council, because the number of road deaths has not decreased in statistical terms since 2011. Before then, there had been a rapid decline in numbers.
Despite Britain having voted to leave the European Union, PACTS asked political parties to commit to the EU’s proposed changes to vehicle safety regulations, and for the establishment of a UK road collision investigation body, to oversee how road collision information is collected and used.
As far as PACTS is concerned, such an overhaul would include tackling dangerous driving, making the roads safer for cyclists and pedestrians, encouraging the development of safer vehicles, and changing attitudes towards death on our roads so that safety has the same priority as it does on other modes of transport such as trains and aeroplanes.
Pedestrian and traffic surveys
Survey data can play a crucial role in improving road safety both locally and nationally. Understanding how people use the roads, knowing where so-called accident blackspots occur, and showing the relationship between road users and pedestrians gives local authorities, planners and road safety specialists access to qualified, accurate data that gives a clear picture of the way particular roads are used.
This data can then be used to influence traffic calming measures, the introduction of cycle paths, wider pavements and barriers to keep pedestrians safe, the siting of pedestrian crossings and other measures to help keep the roads safe for all road users.
Traffic surveys from RDS
At Road Data Services we design, implement and report data from traffic surveys, pedestrian surveys, parking surveys and more. Our data is supplied in the format that’s best for you, and we work with planners, developers, road safety groups, local authorities and others to help improve road planning and design and make our roads safer places to be.
To find out more about how we can help, just contact us today.

