Why does Journey Time data matter?
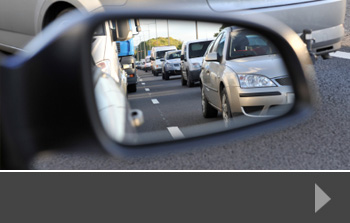
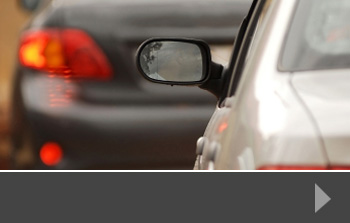
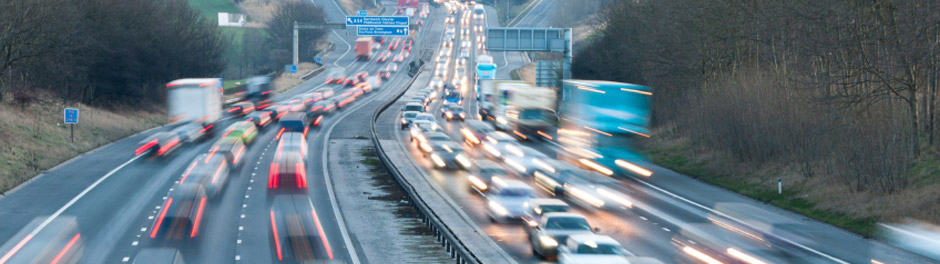
One of the specialist services we offer at RDS is journey time surveys. These are dedicated surveys that test the average journey time from point A to point B. These journeys can be done at different times of day to see the difference in journey time between a rush-hour trip, for example, and a journey at a quieter time of day.
The data collected by a journey time survey helps planners and traffic managers to see exactly where the slow or congested parts of a route are, and how much impact they have on the time it takes to get from one point to another. Slower journeys have an economic and environmental impact, and collecting accurate data helps to assess this impact and see where improvements could be made.
How does a journey time survey work?
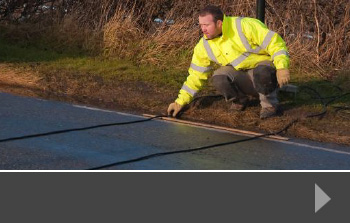
In order to collect accurate data, we take a vehicle on the journey between your two stated points. Using dashcam and manual evidence, we show every step of the journey, recording incidents or areas of concern.
At the start of the project, we’ll agree with you how many journeys to undertake and at which times of day. This will help to give you a spread of data, which is far more useful than the data collected from a single trip.
You may also want us to measure the journey time between the two points using a different route, so that you have one or more bases of comparison for the journey. This might help with diversions, or with signage that helps to reduce congestion.
Once we have completed all the agreed journeys, we can deliver the data we’ve collected, including video footage, so that you have a complete picture of the route and its issues. This gives you essential data to help you make informed decisions about any changes or re-routing to help the people using the roads in your area.
National travel time measures
The Department for Transport collects data on travel time for the strategic road network (SRN), and on local A roads. This data shows the average delay across the network, compared to a journey conducted at all the relevant speed limits. On the SRN 2018, for example, the average delay was 9.4 seconds per vehicle per mile. The average speed was 59mph. For A roads, the average delay was 47.3 seconds per vehicle per mile and the average speed 24.9mph. These statistics, both on a national level and when broken down to individual roads, give valuable information that allows planners to suggest areas for improvement to increase traffic flow and reduce congestion.
To find out more about how RDS can help you assess journey time, contact us today.